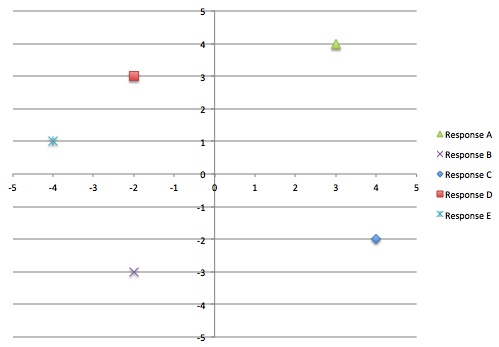
Biaxial graphYou could also use a simple two axis graph and ask them to plot out their 5 choices on the graph. On the x-axis, you could ask them to rate how desirable is this response? On the y-axis, you could ask them to rate how practical is this response?
The graph could have positive and negative values as shown here, or simply positive values. Would you have them place all 5 responses on the same graph? This would be more space efficient, and easier to group with the question stem, and easier for candidates to comparatively place their responses. But it would be harder to program this. |
Map: SJT Concordance (539)
|
||
|
Review your pathway |